Follow us on LinkedIn
A technical or quantitative trading system on a linear (i.e. delta 1) instrument is basically a bet on the autocorrelation of the underlying. The autocorrelation properties of the underlying can be examined directly through autocorrelation functions or indirectly through the Hurst exponent.
In this post, we are going to examine the mean-reverting and trending properties of SP500 directly using the autocorrelation functions. We do so with the goal of designing quantitative trading systems on stock indices.
Recall that,
Autocorrelation, also known as serial correlation, is the correlation of a signal with a delayed copy of itself as a function of delay. Informally, it is the similarity between observations as a function of the time lag between them. The analysis of autocorrelation is a mathematical tool for finding repeating patterns, such as the presence of a periodic signal obscured by noise, or identifying the missing fundamental frequency in a signal implied by its harmonic frequencies. It is often used in signal processing for analyzing functions or series of values, such as time domain signals. Read more
We implemented the autocorrelation functions in Python. We downloaded SPY data from 2009 to the present from Yahoo Finance. We then applied the Python program to the daily and monthly returns of SPY.
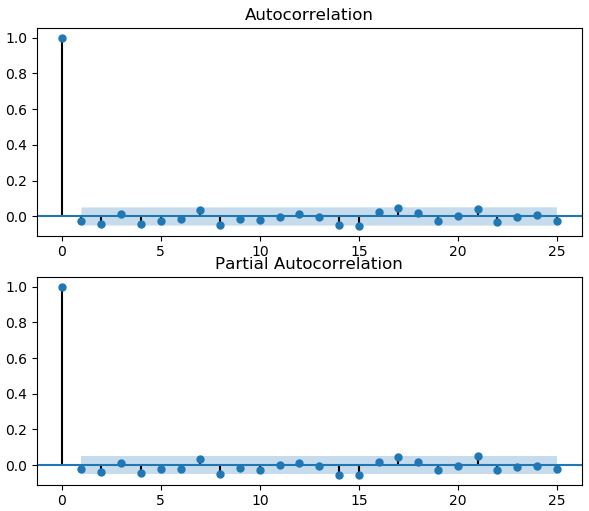
The graph below shows the autocorrelation (ACF) and partial autocorrelation (PACF) functions of daily SPY returns. We note that SPY returns are negatively correlated at lags 2-4, i.e. SPY is mean-reverting in the short term. This is consistent with the findings in the previous study performed using the Hurst exponent.
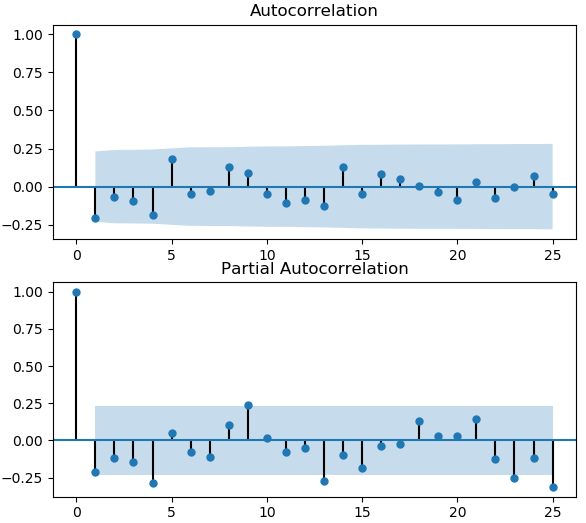
The graph below shows the autocorrelation and partial autocorrelation functions of monthly SPY returns. We observe that the monthly returns are positively correlated around lag 9. This means that in a long term, SPY is trending.
In summary, using the autocorrelation functions, we demonstrated that the SP500 is mean-reverting in the short term and trending in the long term. In the next installments, we will design trading systems based on the mean-reverting and trending properties of SPY.
Further questions
What's your question? Ask it in the discussion forum
Have an answer to the questions below? Post it here or in the forum


but i also see that is mean reverting in longer time periods as seen in the charts. do you ignore 20+ lags?
True, we ignore the 20+ lags as it’s the timeframe we’re not interested in. I remember there is a research paper that stated that in a very long timeframe, stock indices are mean reverting. If I find it I will post it here. Thanks for asking.