Follow us on LinkedIn
If you’re looking to set up your own algorithmic trading business, quantitative trading is a market you can consider. Many independent investors are exploring the market, learning to generate data, and execute it.
In the past, quantitative trading used to be the business of hedge funds and other financial institutions involving huge sales of shares. The shares in this business run in many hundred thousands, together with the securities. Working for a hedge fund may be the reason you learn about the quantitative trading system.
What is quantitative trading?
Quantitative trading involves using quantitative analysis to identify points with a profitable trade where you can buy assets. This is a branch of quantitative finance. To find an opportunity for trading, a trader has to compute a set of mathematical data in order to determine a market is most likely profitably within a period.
The type of asset involved in a single quantitative trade and the type of research used in the analysis will be the trader’s sole choice. The process of developing a workable trading strategy requires careful study and testing to ascertain the loops in the system before the execution.
Heavy mathematical modeling and computation form the basis of quantitative analysis trading. To keep up with these computations, a trader has to be versed in a relevant computer program. Some of these programs include MATLAB, Python, R, C/C++, network latency optimization, etc.
Breakdown of Quantitative Trading
In quantitative trading, your business is to use the mathematical models you generate to learn the possibility of getting a certain outcome. The only possible way to achieve this in quantitative finance is by using programming and statistics. Your interest is in the volume and price of a trade, not in the strength of the brand.
Therefore, assume that the stock of a certain business rises in volume, which also affects its pricing. You then work out a program targeted at identifying how this pattern occurs in the history of the business. How does this kind of rise affect the market value of this business?
Let’s say the result of your research says the business has experienced a 90% growth from this type of rise over the years. It means that there’s a 90% chance for such growth in the future.
Who does Quantitative Trading?
People who have a background in financial modeling, math, or engineering are more likely to excel in quantitative analysis, and by extension, quantitative trading. Added to these skills, these individuals need a strong understanding and ability to handle any of the programming software that includes Python, R, and C/C++, plus APIs (application programming interfaces).
Some of the added skills that a funds company will need a person to have included being able to create automated data and mine data. These are the same skills an individual trader needs. However, you should also have a proficiency in understanding kurtosis, VaR (Value at Risk), and conditional probability.
Quantitative trading involves mathematical computations in all of its entirety. This feature is what distinguishes it from the traditional investment platform where you consider brand behavior.
A trait that you’ll find among traders is that they may decide to customize an existing strategy that is proven as successful, in addition to building their own. They go ahead to create programs that help them identify the opportunities in a strategy, thereby creating time to research more strategies.
A part of the job of quantitative traders is the high-frequency trading (HFT). In HFT, they work on many positions in the short term, opening and closing with the help of programming.
This strategy is not for every fund group or trader. In some cases, the trader uses a model to find out trades that are larger and less frequent as part of their strategy for the long-term.
Traders who use HFT need computer programs for this technique because it involves so many short transactions that should be identified and executed at once. A programming strategy would be more efficient than human analysis to avoid time lapse and loss.
Major components of Quantitative Trading
Singling out opportunities and executing them are the basics of every quantitative trading system. Every system is unique in the way it identifies positions and executes. But, the components are integrated across the board.
They include:
- Identifying the Strategy
- Backtesting it
- System of Execution
- Risk Management
Here’s a breakdown of these concepts.
Identifying the Strategy
Every process of quantitative trading starts with research. Research helps you to find your strategy. You can analyze this strategy by fitting it into your existing portfolio, to check if it aligns with your other strategies. Further, obtain all data necessary to test your strategy while optimizing it for lower risks and more returns.
As an individual trader, factor in the costs involved, including your capital and the effect of these transactions.
Public sources can be a good place to find strategies that are profitable. These sources include trade journals, academic publications, and quantitative finance blogs. The details they offer vary as well.
Public source strategies do not include the parameters and methods of tuning. If you are able to find a suitable pattern for optimizing them, these can become highly profitable strategies.
A strategy can have Low-frequency trading (LFT), high-frequency trading HFT), and Ultra-high frequency trading (UHFT). These frequencies refer to how long a strategy will hold an asset. LFT will stay longer than one trading day; HFT will hold intraday and UHFT will hold for milliseconds and seconds.
With your strategy set up, the next thing is to backtest it, to know how profitable it is.
Backtesting your strategy
In backtesting, you apply the strategy you picked to both historical and out-of-sample data to prove that it is profitable. Your result tells you what to expect of the strategy in a real trade, even though it doesn’t always translate exactly.
While backtesting, you’ll meet several biases; you’ll need to consider them diligently before eliminating them. The biases will include look-ahead bias, data-snooping bias, and survivorship bias.
Also, look out for how clean and available historical data is, which includes providing a backtesting platform that is robust and costs that are realistic.
After identifying a strategy, get the historical data since this will help you with testing and refinement. Here are some issues that concern using a historical set of data.
Cleanliness/Accuracy
Does the data contain any error? In some cases, it’s easy to pick out errors. Other times, it’s well-hidden in plain sight. If possible, have a team of providers who weigh their data with each other to identify biases.
Survivorship bias
Does the data contain delisted or bankrupt stocks? Are the assets still trading?
Survivorship bias is a feature you look out for in a cheap set of data. You want to know if the assets are in a trade or not. Trades that have left the market or bankrupt stocks will not perform in real life.
Besides, cheap data will often perform better during backtesting than they would in the real world.
Corporate actions
What are the dividend adjustments and stock splits in the trade? That is, activities of the company that take away from the price returns.
In all cases, movements will create a step-function change in the raw price of the company. This change does not form part of the price returns when you’re calculating. In fact, you should carry out back adjustments when you make these changes. You want to avoid confusing a stock split with actual returns adjustments.
When you’ve established your history data set, you need a software platform that can be either of a dedicated backtest software, a complete custom implementation using a programming language, or a numerical platform.
To measure the performance of your strategies, you’ll need to know the maximum drawdown and the Sharpe Ratio. In maximum drawdown, you’re measuring the equity curve drop from peak to trough in a specific period, as a percentage.
In Sharpe Ratio, you’re taking the average of the excess returns and dividing it by their standard deviation. This excess return is measured against the expected benchmark for the strategy’s return.
Done with backtesting, you can then execute.
System of Execution
With the list of trades your strategy has generated, you can build a manual execution system or an automated system. In a manual system, your business is to keep your broker on a call while you place your trades. Otherwise, build a semi-automated or fully-automated system for your execution.
An LFT strategy will thrive on manual or semi-automated systems while HFT strategies are best suited for fully-automated systems. Automated systems help you create extra time to look for more strategies and run them.
3 factors you should consider in creating your execution system include your broker’s interface, how to minimize transaction costs and performance divergence from backtested performance.
Individual traders will often handle their execution themselves while established hedge funds will have their dedicated executor.
In executing, you also need to minimize the cost of transactions which includes commissions, slippage, and spread. The brokerage charges commissions; slippage tells the difference in the price of your order and your initial estimate, while the spread is the gap in the bid/ask price of the security you’re trading. Spread, however, is not a constant factor.
Transaction costs, in itself, can be the shift from a very unprofitable strategy to a highly profitable strategy. These costs can barely be detected in a backtest, which is why you need to be critical about analyzing your transaction costs.
About divergence of strategy from backtested performance, some bugs and invisible trading strategies may only emerge in life transactions. Some of them include a new regulatory environment, macroeconomic phenomena, and change in investor sentiment. All these are in addition to life-ahead, data snooping, and survivorship biases.
Risk Management
Risk management includes your ability to work around the list of biases mentioned before. It also includes the risk of technology (like a dysfunctional server) and brokerage bankruptcy. Think of anything that can impact the trading system; it’s a risk you should manage.
Portfolio theory (i.e. optimal capital allocation) is part of the risk management system. It’s about deciding how to allocate funds to the various strategies and the trades that lie within each strategy. It’s a complex system that requires great thought and diligent execution.
Your personal disposition could also be a threat to your trades. It’ll determine how fast you are with making decisions, your ability to dispassionately make a good decision and to cancel out the greed in your trades.
Pros and Cons of Quantitative Trading
The pros and cons associated with this business is embedded in the transactional process and the returns from it. They are as follows:
Pros
- Quantitative Trading helps you determine how profitable a system before executing a trade
- You can arrive at a less flawed decision through monitoring and analysis before the system is overwhelmed with data
- Computers are efficient in automated monitoring and analysis, therefore enhancing the rate of decision making
- Access to a large market and extensive data points list
- Less emotional involvement since AI handles a good part of the decision making system
Cons
- Ability to remain as dynamic as the financial market system.
- Strategies are often momentarily profitable. Many do not survive changes in the market condition
Conclusion
Quantitative trading is a model that uses mathematical computation to determine existing opportunities. This requires quantitative traders to have an extensive background in mathematics, statistics, programming, and related fields. Creating an effective quantitative trading system requires 4 components including strategy, backtesting, execution, and risk management.
A good majority of quantitative traders work for established systems such as investment firms and hedge funds. However, individuals are beginning to start their own quantitative trading and require more computational skills since they have to manage the system alone.
Quantitative Volatility Trading
In this part, we will look at volatility trading from the quantitative perspective.
We first need to estimate the current volatility
Close-to-Close Historical Volatility
The Close-to-Close Historical Volatility has the following characteristics [1]
Advantages
- It has well-understood sampling properties
- It is easy to correct bias
- It is easy to convert to a form involving typical daily moves
Disadvantages
- It is a very inefficient use of data and converges very slowly
Parkinson Historical Volatility
The Parkinson volatility has the following characteristics
Advantages
- Using daily ranges seems sensible and provides completely separate information from using time-based sampling such as closing prices
Disadvantages
- It is really only appropriate for measuring the volatility of a GBM process. It cannot handle trends and jumps
- It systematically underestimates volatility.
Garman-Klass Historical Volatility
The Garman-Klass volatility estimator has the following characteristics
Advantages
- It is up to eight times more efficient than the close-to-close estimator
- It makes the best use of the commonly available price information
Disadvantages
- It is even more biased than the Parkinson estimator
Garman-Klass-Yang-Zhang Historical Volatility
We note that the Garman-Klass-Yang-Zhang volatility estimator takes into account overnight jumps but not the trend, i.e. it assumes that the underlying asset follows a GBM process with zero drift. Therefore the GKYZ volatility estimator tends to overestimate the volatility when the drift is different from zero. However, for a GBM process, this estimator is eight times more efficient than the close-to-close volatility estimator.
Implied Volatility
The implied volatility (IV) of an option contract is that value of the volatility of the underlying instrument which, when input in an option pricing model (such as Black–Scholes), will return a theoretical value equal to the current market price of said option. Since there is no analytical formula for calculating the implied volatility of an option, we must use numerical root-finding techniques. While there are many techniques for finding roots, two of the most commonly used are Newton’s method and Brent’s method.
Forecasting Volatility
In econometrics, the autoregressive conditional heteroscedasticity (ARCH) model is a statistical model for time series data that describes the variance of the current error term or innovation as a function of the actual sizes of the previous time periods’ error terms; often the variance is related to the squares of the previous innovations. ARCH models are commonly employed in modeling financial time series that exhibit time-varying volatility and volatility clustering, i.e. periods of swings interspersed with periods of relative calm. The Python ARCH package can be used to calibrate the model parameters.
Volatility Trading Systems
We now present a volatility trading system on a volatility ETF.
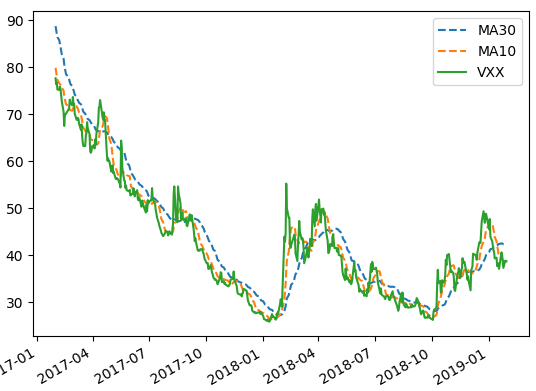
The trading rules are as follows
If 10-day Moving Average (MA10) < 30-day Moving Average (MA30) Sell Short
If 10-day Moving Average (MA10) >= 30-day Moving Average (MA30) Cover Short
The system is implemented in Python. Graph above shows the MAs and VXX for the last 2 years
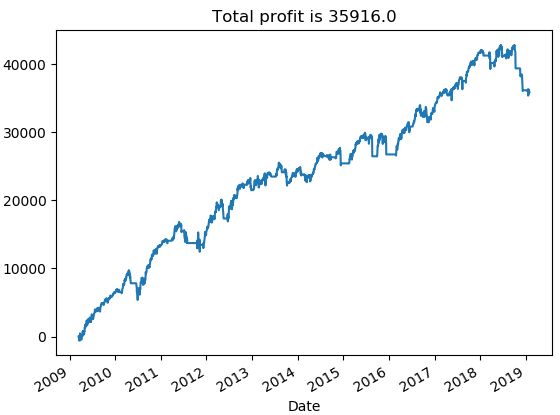
The position size is $10000; leverage is not utilized, and profit is not compounded. Graph below shows the equity curve for the trading strategy from January 2009 to January 2019.
References
[1] E. Sinclair, Volatility Trading, John Wiley & Sons, 2008
Further questions
What's your question? Ask it in the discussion forum
Have an answer to the questions below? Post it here or in the forum
TORONTO — Certain Directors and Officers of AnalytixInsight Inc. (“AnalytixInsight”, or the “Company”) (TSX-V: ALY) today provide an update on recent internal matters respecting its management and board of directors (the “Board”). Please note this Press Release has not been approved by all members of…

perth, April 08, 2024 (GLOBE NEWSWIRE) — CHANGE TO PERSEUS’S SENIOR MANAGEMENT TEAM Perth, Western Australia/April 8, 2024/Perseus Mining Limited (ASX/TSX: PRU) wishes to advise that its Chief Operating Officer (COO), Mr. David Schummer, has advised that he will resign from the Company with effect from…