In the previous post, we presented a system for trading VXX, a volatility Exchange Traded Note. The trading system was built based on simple moving averages. In this post, we are going to examine the time series properties of VXX in more details.
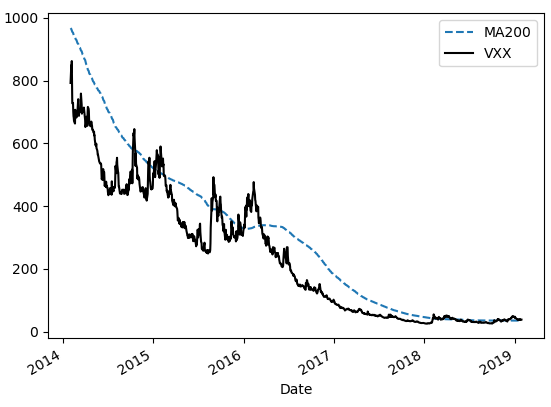
The figure below shows the VXX and its 200-day moving average for the last 5 years. From the Figure, it’s evident that the time series has a strong downward drift. The cause of this downward drift has been discussed to a great extent in the investment community. It will not be a subject of this post.
Next, we calculate the daily returns of VXX and perform the Augmented Dickey-Fuller test to check the stationarity of the return series. According to Wikipedia,
..An augmented Dickey-Fuller test (ADF) tests the null hypothesis that a unit root is present in a time series sample. The alternative hypothesis is different depending on which version of the test is used, but is usually stationarity or trend-stationarity. It is an augmented version of the Dickey-Fuller test for a larger and more complicated set of time series models. The augmented Dickey-Fuller (ADF) statistic, used in the test, is a negative number. The more negative it is, the stronger the rejection of the hypothesis that there is a unit root at some level of confidence. Read more
We utilize Python to run ADF test on the return series. The test statistic is -19.5 and the p-value is zero. Therefore the return series is stationary.
We then proceed to examine the autocorrelation functions of VXX returns.
Autocorrelation, also known as serial correlation, is the correlation of a signal with a delayed copy of itself as a function of delay. Informally, it is the similarity between observations as a function of the time lag between them. The analysis of autocorrelation is a mathematical tool for finding repeating patterns… Read more
The plot below shows the autocorrelation (ACF) and partial autocorrelation (PACF) functions of VXX returns.
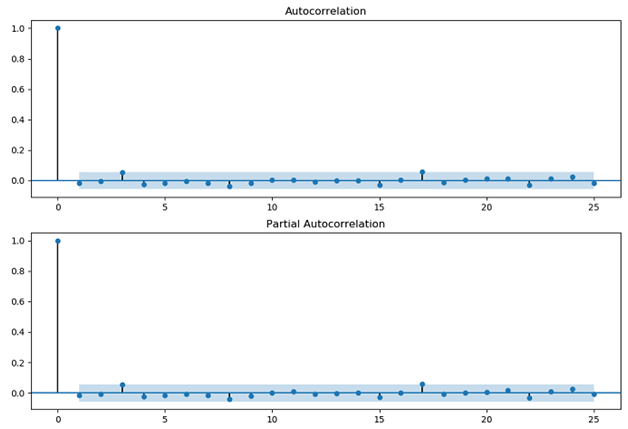
It’s interesting to note that VXX returns are positively auto-correlated at 3-day lag. It’s well-known that the stock indices are mean reverting in the short term. Here we observe the opposite, i.e. a trending property.
To download the accompanying Excel workbook or Python program for this post:
1. Subscribe to the newsletter. If you're already a subscriber, go to the next step
2. Once subscribed, refer a friend
After completing these steps, you’ll gain access to the file for this post, along with files for a dozen other posts.
Further questions
What's your question? Ask it in the discussion forum
Have an answer to the questions below? Post it here or in the forum