Follow us on LinkedIn
In a previous post, we presented statistical tests for the Australia/Canada country ETF pair. Specifically, we calculated the return correlation and performed cointegration tests using a training set consisted of 8 years of data. The high correlation and the fact that the pair spread passed 2 cointegration tests made this pair a good candidate for trading. In this follow-up post, we are going to implement a trading strategy using this pair in Python. We utilize the remaining 2 years out-of-sample data to generate trading signals and calculate strategy performance.
To generate trading signals, we calculate the z-score of the spread.
In statistics, the standard score is the number of standard deviations by which the value of a raw score (i.e., an observed value or data point) is above or below the mean value of what is being observed or measured. Raw scores above the mean have positive standard scores, while those below the mean have negative standard scores.
It is calculated by subtracting the population mean from an individual raw score and then dividing the difference by the population standard deviation. This process of converting a raw score into a standard score is called standardizing or normalizing (however, “normalizing” can refer to many types of ratios; see normalization for more). Read more
We then use the z-score to enter and exit the trade. The picture below shows the cumulative return of the strategy from January 2019 to November 2020.
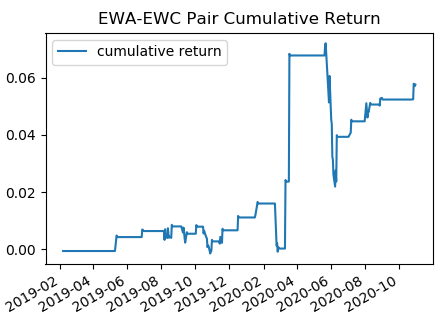
It’s interesting to observe that the strategy performed well in general, but experienced a large PnL swing during the pandemic.
The table below summarizes the performance of each ETF along with the pair strategy.

We note that although in terms of annualized return, the pair strategy (0.058 p.a.) did not outperform the Buy and Hold, but in terms of risk-adjusted return, it outperformed (Sharpe ratio of 0.647) the Buy and Hold by a large margin.
The Python program below will allow you to perform statistical tests on a pair. It does not include the backtesting part.
Further questions
What's your question? Ask it in the discussion forum
Have an answer to the questions below? Post it here or in the forum