Follow us on LinkedIn
In a previous post, we presented theory and a practical example of calculating implied volatility for a given stock option. In this post, we are going to implement a model for forecasting the implied volatility. Specifically, we are going to use the Autoregressive Integrated Moving Average (ARIMA) model to forecast the volatility index, VIX.
In statistics and econometrics, and in particular in time series analysis, an autoregressive integrated moving average (ARIMA) model is a generalization of an autoregressive moving average (ARMA) model. Both of these models are fitted to time series data either to better understand the data or to predict future points in the series (forecasting). ARIMA models are applied in some cases where data show evidence of non-stationarity, where an initial differencing step (corresponding to the “integrated” part of the model) can be applied one or more times to eliminate the non-stationarity.
The AR part of ARIMA indicates that the evolving variable of interest is regressed on its own lagged (i.e., prior) values. The MA part indicates that the regression error is actually a linear combination of error terms whose values occurred contemporaneously and at various times in the past. The I (for “integrated”) indicates that the data values have been replaced with the difference between their values and the previous values (and this differencing process may have been performed more than once). The purpose of each of these features is to make the model fit the data as well as possible. Read more
It is shown in Reference [1] that the implied volatility index can be modeled and forecasted using the ARIMA model. To apply the ARIMA model to the VIX index, we first downloaded 5 years of historical data of the VIX from Yahoo Finance. Next, we used the first 4 years of data as the training set and fit the data to the ARIMA model. The Python SARIMA program returned the following model parameters,
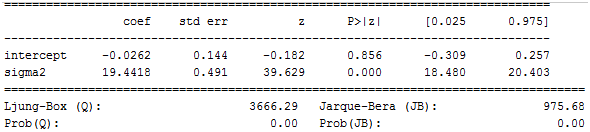
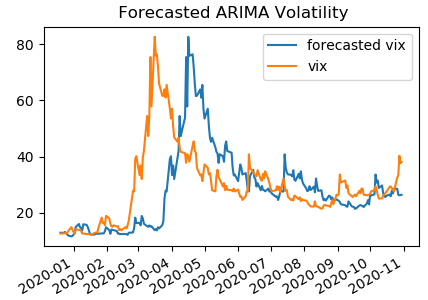
After obtaining the parameters, we applied the model to the remaining 1 year of data and calculated the forecasted VIX on a rolling window of 1 month. The picture below shows the rolling forecasted VIX along with the VIX index,
References
[1] K. Ahoniemi, Modeling and forecasting implied volatility, Helsinki School of Economics, 2009.
Further questions
What's your question? Ask it in the discussion forum
Have an answer to the questions below? Post it here or in the forum

CEO Joseph Otting took over NYCB in April after an investor group led by former Treasury Secretary Steven Mnuchin injected more than $1 billion into the lender.
The Information reported late Monday that Musk is laying off around 500 employees on its Supercharger team.
One Facebook user joked he would find a "better seat" for the Qantas customer whose details he was shown after the frequent flyer app issue.